Phase 1: Survey & Engineering
This post is the first article from "5 Phases of DAS Deployment".

Best way to understand the whole design process is through a few key questions.
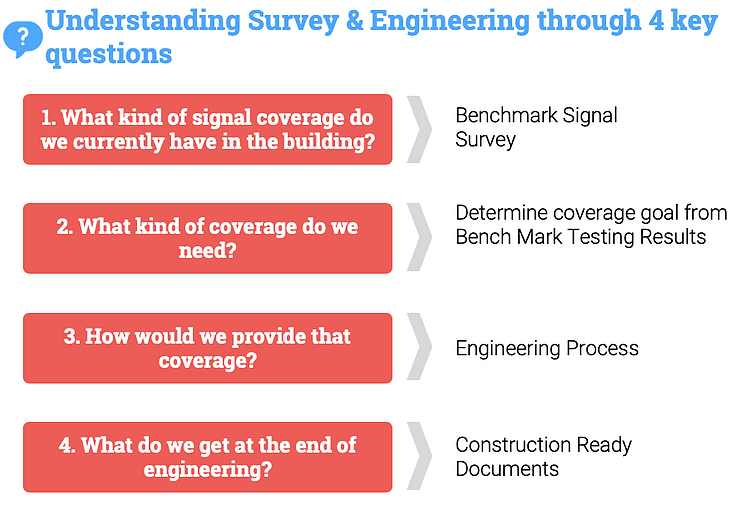
Design process involves answering these vital questions:
What kind of signal coverage we currently have in the building? : This involves Benchmark Signal Survey. This gives us the profile of signals we currently have in the building.
What kind of coverage do we need? Basically, engineers come up with coverage goal floor by floor, by analyzing the data collected in the benchmark signal survey. First 2 questions are answered through Site Survey process. We collect a lot more information than just bench mark signal survey, and we will go into details of survey in the next section.
Next obvious question is, How would we provide that coverage? This entails the actual design & engineering of DAS.
Last question is, What do we get at the end of the design? And these are the deliverables from the survey and engineering process, which are the construction ready documents.
Site Survey:
2 types of data will be collected in this phase and they can usually be collected in 1 trip:
Benchmark or Base signal measurement
Collecting building information
Benchmark or Base Signal Measurement:
As I have mentioned before Benchmark Signal Measurement allows us to find out what kind of signal we currently have in the building. We can collect this data manually, but industry standard is to do it by using a combination of signal scanner and collection and reporting software.
Benchmarking Tools
There are quite a few tools available in the market.

For large areas, such as venues, it’s a standard is to use tools such as Qualipoc, JDSU or VIAVI, TEMS, NEMO, XCAL, PCTEL or Solutelia gears. These 'gears' are a combination of hardware (for example, laptop with dongles, scanners, etc.) and software that captures and plots signals over a floor plan). Basically, a typical gear will use a 'scanner' or 'receiver’ or a phone to receive the signals at any point of the floor and then plot that signal information on the floor plan. For example, in our company we use iBFlex Scanner from PCTEL and data collection and reporting software (WINd Pro) from Solutelia.
Benchmark Output
Enormous amount of signal data is collected during benchmarking. After quite a bit of data crunching, engineers basically generates a heat map of ambient signal. Multiple plots may be generated for each floor. So for example, in this sample layout below we are looking at the color coded output of a signal parameter known as LTE RSRP. This tells the Engineers the strength of the LTE signal currently available on this floor. LTE RSRP is just one of many sets of data that will be collected.

Determining Coverage Goal
With benchmark survey we can find out what kind of signal we currently have in the building. Now we’ll have to figure out what kind of coverage we need. Once we figure out the coverage goal, then the engineers will design a DAS that will meet that goal.
2 factors guides this process.
First factor is Carrier or Operator standard.
Every operator – AT&T, Sprint, TMBL or VZ have their own standard for coverage. Here is an example of one such standard from one operator. Their standard says if you are going to add UMTS technology in 1900 & 2100 frequencies, signal strength parameter or RSCP has to be minimum -85dBm or 8dB stronger than macro network at 95% of the coverage area. Macro network means operator’s network on the outside – basically cell towers. This means whatever is coming into the building from outside, the DAS should broadcast a signal 8 dB greater inside. If you are not familiar with dB or decibel math, 8 dB is more 4 times the strength of current signal coming inside from macro (i.e., outdoor) network.
Operators have a lot of such requirements in the standard document, good engineers will have to be familiar with all of them.
The 2nd factor is business factor. Consider the following scenarios or questions:
What kind of service customer needs or is requesting? Let’s say customer just want a coverage for voice calls only, and does not care about data, because the company has its own robust WiFi system.
What kind of coverage makes business sense? Just establishing enough signal for voice calls may be cheaper than having a very sophisticated advanced DAS needed for good data rate.
It boils down to the budget versus need for coverage. For example, a business who is funding it’s own DAS, may just want coverage only in office area which is fraction of the area they own. So they may not design a DAS to cover the whole building. Engineers will have to assess the coverage need of the customer before starting the design phase.
Collecting Building Information
Along with benchmark signal data, engineers also collect 2 types of building information during survey.
Information type 1: Information that may impact construction & logistics. They are:
Point of Contact of the building or POC, & Access Information,
Badging & escorting protocols,
Safety training requirement
Working hour
Materials staging,
Infectious control & HEPA filter (for hospitals) and other relevant information.
Information type 2: Information that will impact design and materials. These are:
Head-end room & remote locations – basically MDF & IDFs
Electrical Info
GPS or donor location,
Cable route, and support inside the building
Floor-to-floor penetration
Fiber layout, etc.
Both types of information are important for coming up with design, materials and construction cost.
Engineering
Now that we know what kind of signal coverage is in the building and kind of coverage we need, next obvious question is, how would we provide that coverage? This takes us to the actual engineering process.
First, a quick overview of the engineering steps:
Let’s start with the engineering tool DAS Engineers use. They use programs such as iBwave or EDX or RANPlan. iBwave is more popular and well known in the industry.
At the heart of engineering analysis are: Link Budget & Propagation Analysis, and we can use iBwave to automate these functions. From these analyses, we can generate logical diagram that will show which electronics can be used and how all major electronics will be connected.
Engineers will generate floor plans with device locations – one of the most important construction documents.
We will get a bill of materials – that tells us what kind of electronics or active devices are needed as well all passive materials such as coaxial and fiber cable, number and type of couplers, connectors, jumpers , etc.
We can also get a propagation plot – which is like a heat map and it is predictive, basically the heat map will tell us if we install all the elements as the program is showing we should get a signal captured in the propagation plots.
Several different kinds of reports will also be produced at this point. They are: signal quality related reports such as SINR, MAX data rate, and EMF or electromagnetic field report (i.e., RF exposure report related to public health).
Link Budget & Propagation Analysis
Link Budget figures out how much signal will come out of the antenna and reach a phone.

Engineers know how much power is going into the DAS from the signal source. By calculating gains and losses through the system, engineers will be able to calculate how much power will come out of an antenna, and eventually how much power will reach the phone (see figure above). So link budget is basically an accounting of all the gains and losses in a transmission system.
Propagation analysis figures out based on the output power from the antenna, how far will the signal travel and still be useable by the phone.

Think of light coming out of a bulb. How far will the light travel from the light bulb depends on the intensity of the light. However, if there is a wall on the way, light will stop at the wall.
When it comes to RF signal, it will go through the wall like Casper the friendly ghost, but every time signal goes through a wall it loses its strength. How much strength will it lose? That depends on the type of the wall.
So where do we put the next antenna so that users can enjoy seamless coverage in the building? Engineers look at all the walls that will surround the antenna, and their types– is it a dry wall, or concrete wall, or metal wall. They will feed those data into path-loss mathematical model. From those calculations, they will figure out where to put the next antenna so that users can enjoy seamless coverage in the building.
Survey and Engineering Deliverables
What deliverables the customer should expect from the surveyor and engineers? Short answer is construction ready documents.
From the survey part, you should get all the benchmark data superimposed on the floor-plans. Also, you need to keep the raw data, because sometimes the carriers want to see these. As for the building information, engineers will need those for developing designs for the DAS, you probably don’t need them.

There are 3 documents from the Engineering process that are important. These documents are Logical Diagram, Floor Plan with Device Locations and List or Bill of Materials. They are important, because you can actually build the DAS from these 3 documents – they are the construction ready documents. Few other documents can help out the low voltage vendors or equipment installers are: elevation drawing, connection line diagram, etc. Additional documents such as propagation or predictive plots, SINR plots that shows signal to noise ratio or signal quality, EMF reports etc. These have more value from RF Engineering perspective, but not so much for construction.
Now, a quick overview of the engineering deliverables we just mentioned…
Logical Diagram:
Logical diagram provides an overview of DAS from head-end all the way to the antennas – it shows how they are connected, input/output power level, etc. I am showing a sample logical diagram below.

With this diagram, you get a quick overview of all the elements or devices that will be needed to build the DAS. But where are they going to be located? For that, let’s go to the floor-plan with device locations.
Floor-plan with device locations:
iBwave generates floor-plans with antenna & device locations and this document is instrumental for DAS construction.
It shows locations of antennas and electronics. You can then match them against the logical diagram and you will see how all elements fit into the overall planning
Shows preferred cable route, and
Also shows where Design calls for the floor penetrations for the DAS to work.

Bill of Materials (BOM)
BOM lists all the materials needed to build the DAS. This is another very important part of the construction ready documents. Following is a snap shot of Bill of Materials.
It will show material parts or model, description of materials and total quantities.

Propagation Plots
Propagation plots are basically signal predictions in the form of a heat map. Based on the all the information engineers have entered into the iBwave program, it will show what kind of signal pattern we can expect. This a quick visual confirming if the DAS will cover the area with the intended coverage goal.

Above is a sample propagation plot. In order to understand the color codes, you will have to read the legend. The legend will show the meaning of the colors (which is basically a signal range). It will show what percentage of signal fall into that color zone, so for example, 96.9% of the signal will be -75 or better. It will also show what operator and frequency is this prediction plot is for. In our plot here, the prediction is for Sprint’s 1900 or PCS band.
Let me briefly explain the color In this particular example… The pink glow close to the antennas indicate signal power between 40s and 50s – which is pretty high. By the way, all the signal readings in this case are in negative; so lower the digits, stronger the signal. For example, -40 dBm signal is 10 times stronger than -50 dBm (because of decibel math). Yellow colors are in high 60s. Then green colors are in low 70s. So over all, we have a pretty sunny forecast!
SINR Plots
SINR or Signal to Noise Ratio indicates the signal quality. In the SINR plot below iBwave is showing the SINR predictions once the DAS will be turned up. Higher the value, better is the signal quality, although values over 8 or 10 is acceptable. Note that the color coding of the heat map shows for this particular design, signal in most areas will have excellent SINR.

SINR or Signal to Noise Ratio (signal quality) prediction
MAX Data Rate Plots
Following is a sample snap shot of Maximum Data Rate predicted for 2100 MHz. You will see in the legend box, that the average data rate will 35 megabits per second. Also color coded are the modulation scheme, such as QPSK, 16QAM or 64QAM – they are indication of data rate too. Note that for most of this design we will get 64QAM, which is better than QPSK or 16QAM.

EMF or Electro Magnetic Field Report
Wireless signal is basically an electromagnetic field. Purpose of the EMF report is to find out if there will be any adverse effect to public health from the electromagnetic field generated by the DAS. Short answer is there is no proven adverse effect. All reputable manufacturers build their DAS electronics within FCC exposure guidelines, which basically prevents them from broadcasting harmful electromagnetic field.

In the next post, we will go over the Phase 2 or Construction of the DAS.
Related Posts: